SATORI
A System for Ontology-Guided Visual Exploration
of Biomedical Data Repositories
SATORI is an ontology-guided visual exploration system for data repositories, which combines powerful metadata search with a treemap and a node-link diagram that visualize the repository structure, provide context to retrieved data sets, and serve as an interface to drive semantic querying and exploration, and thereby support the information foraging loop. SATORI is web-based, open-source, and integrated in the Refinery Platform – an application for biomedical data management, analysis, and visualization.
News
-
Apr 1, 2018 Oxford Bioinformatics
-
Nov 23, 2017 Oxford Bioinformatics
-
Visual Exploration of Biomedical Data: from Small to Big, and Back AgainOct 24, 2017 Novartis Talk
-
Version 1.5 released: SATORI now features a central query interface for handling selected ontology terms. Also support for minimizing or maximizing one of the two visualizations is added. The node context menu of the node-link diagram now shows the OntID and URI. Finally, each main components features an interactive introduction to alleviate the learning curve.Jul 2017
-
To be FAIR, we should give Ontologies and Data Visualization a tryJun 2017 ISMB/ECCB, Prague Talk
-
SATORI: A System for Ontology-Guided Visual Exploration of Biomedical Data Repositories
Oct 26, 2016 IEEE VIS, Chicago Poster
-
SATORI: A System for Ontology-Guided Visual Exploration of Biomedical Data Repositories
Apr 15, 2016 Department of Biomedical Informatics, Harvard Medical School Master Thesis Presentation
-
Approaches for the Integration of Visual and Computational Analysis of Biomedical Data
Apr 6, 2016 BioIT-World Talk
Screencast & Presentation
Introduction
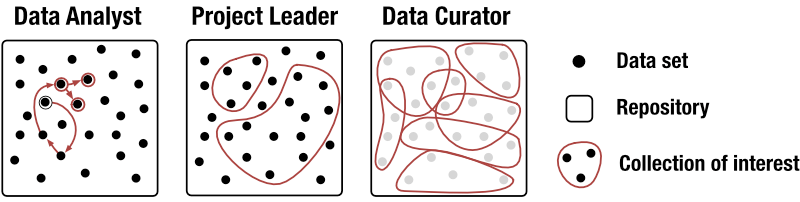
Why? Biomedical repositories are growing rapidly and provide scientists with tremendous opportunities to re-use data. In order to exploit published data sets efficiently, it is crucial to understand the content of repositories and to discover data relevant to a question of interest. These are challenging tasks, as most repositories currently only support finding data sets through text-based search of metadata and in some cases also through metadata-based browsing. To address this, we conducted a task analysis through semi-structured interviews with 8 PhD-level domain experts and identified 3 distinct user roles (Fig. 1).
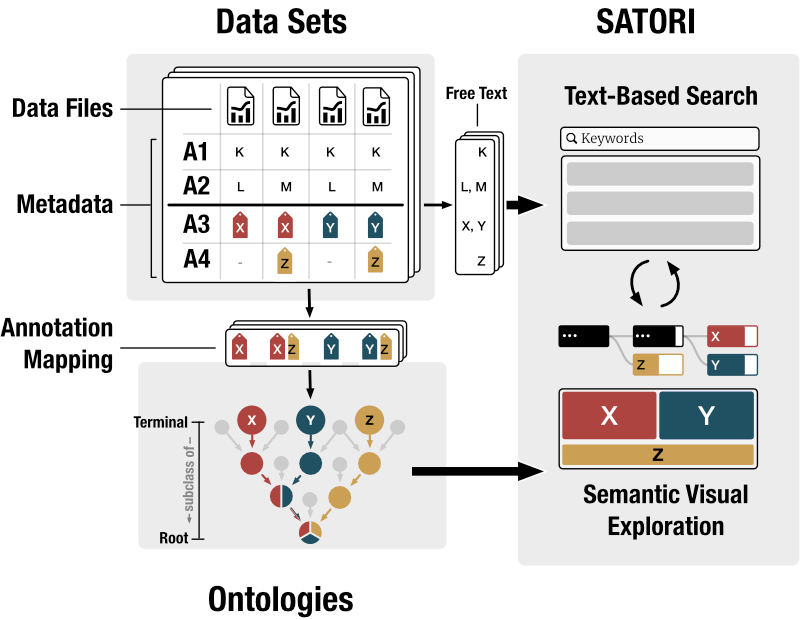
What? Biological data sets consists of experimental data and metadata describing the studies, properties of the analyzed biological samples, and attributes of individual data files. In this context, a data set is a collection of data files, along with the metadata (Fig. 2). Additionally, metadata is partially annotated with ontology terms. An ontology describes a certain domain (e.g. human anatomy), defines controlled vocabularies for its concepts and relationships (e.g., kidney and is-part-of) and relates concepts with each other (e.g., nephron is-part-of kidney). By means of ontology terms, sets of annotated data sets can be classified hierarchically. SATORI extracts free-text and ontologically annotated metadata (Fig. 2). The free-text metadata is indexed in a text-based search system. Additionally, data set-related ontology classes are parsed and visualized to provide semantic context to data sets. Since SATORI's goal is to support exploration rather than to visualize ontologies themselves, only a relevant subtree of the ontologies is shown, i.e., effectively enforcing a strict containment hierarchy (Fig. 3).
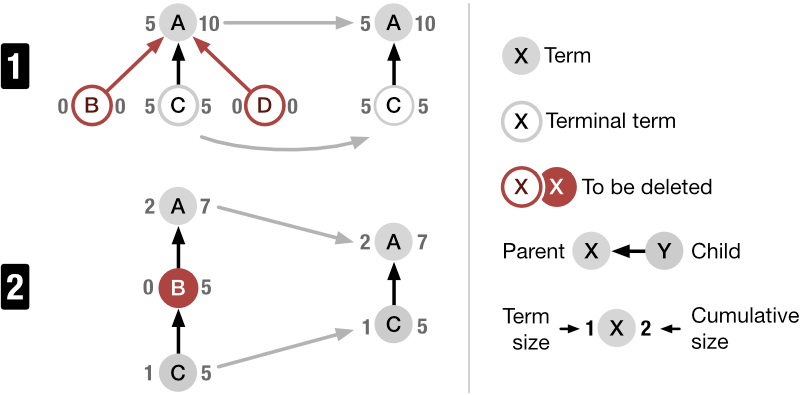
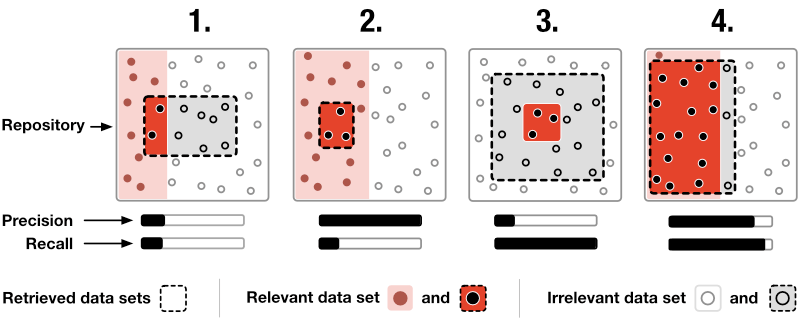
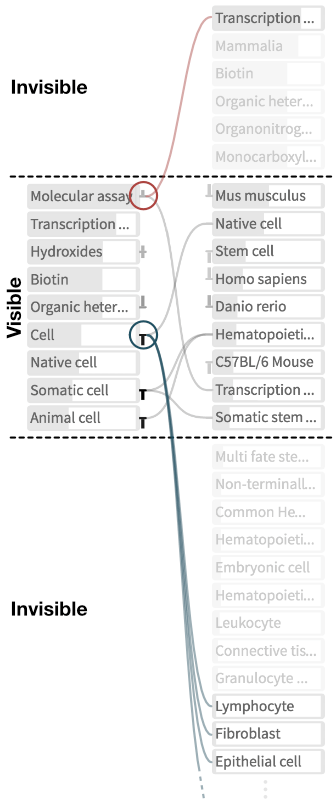
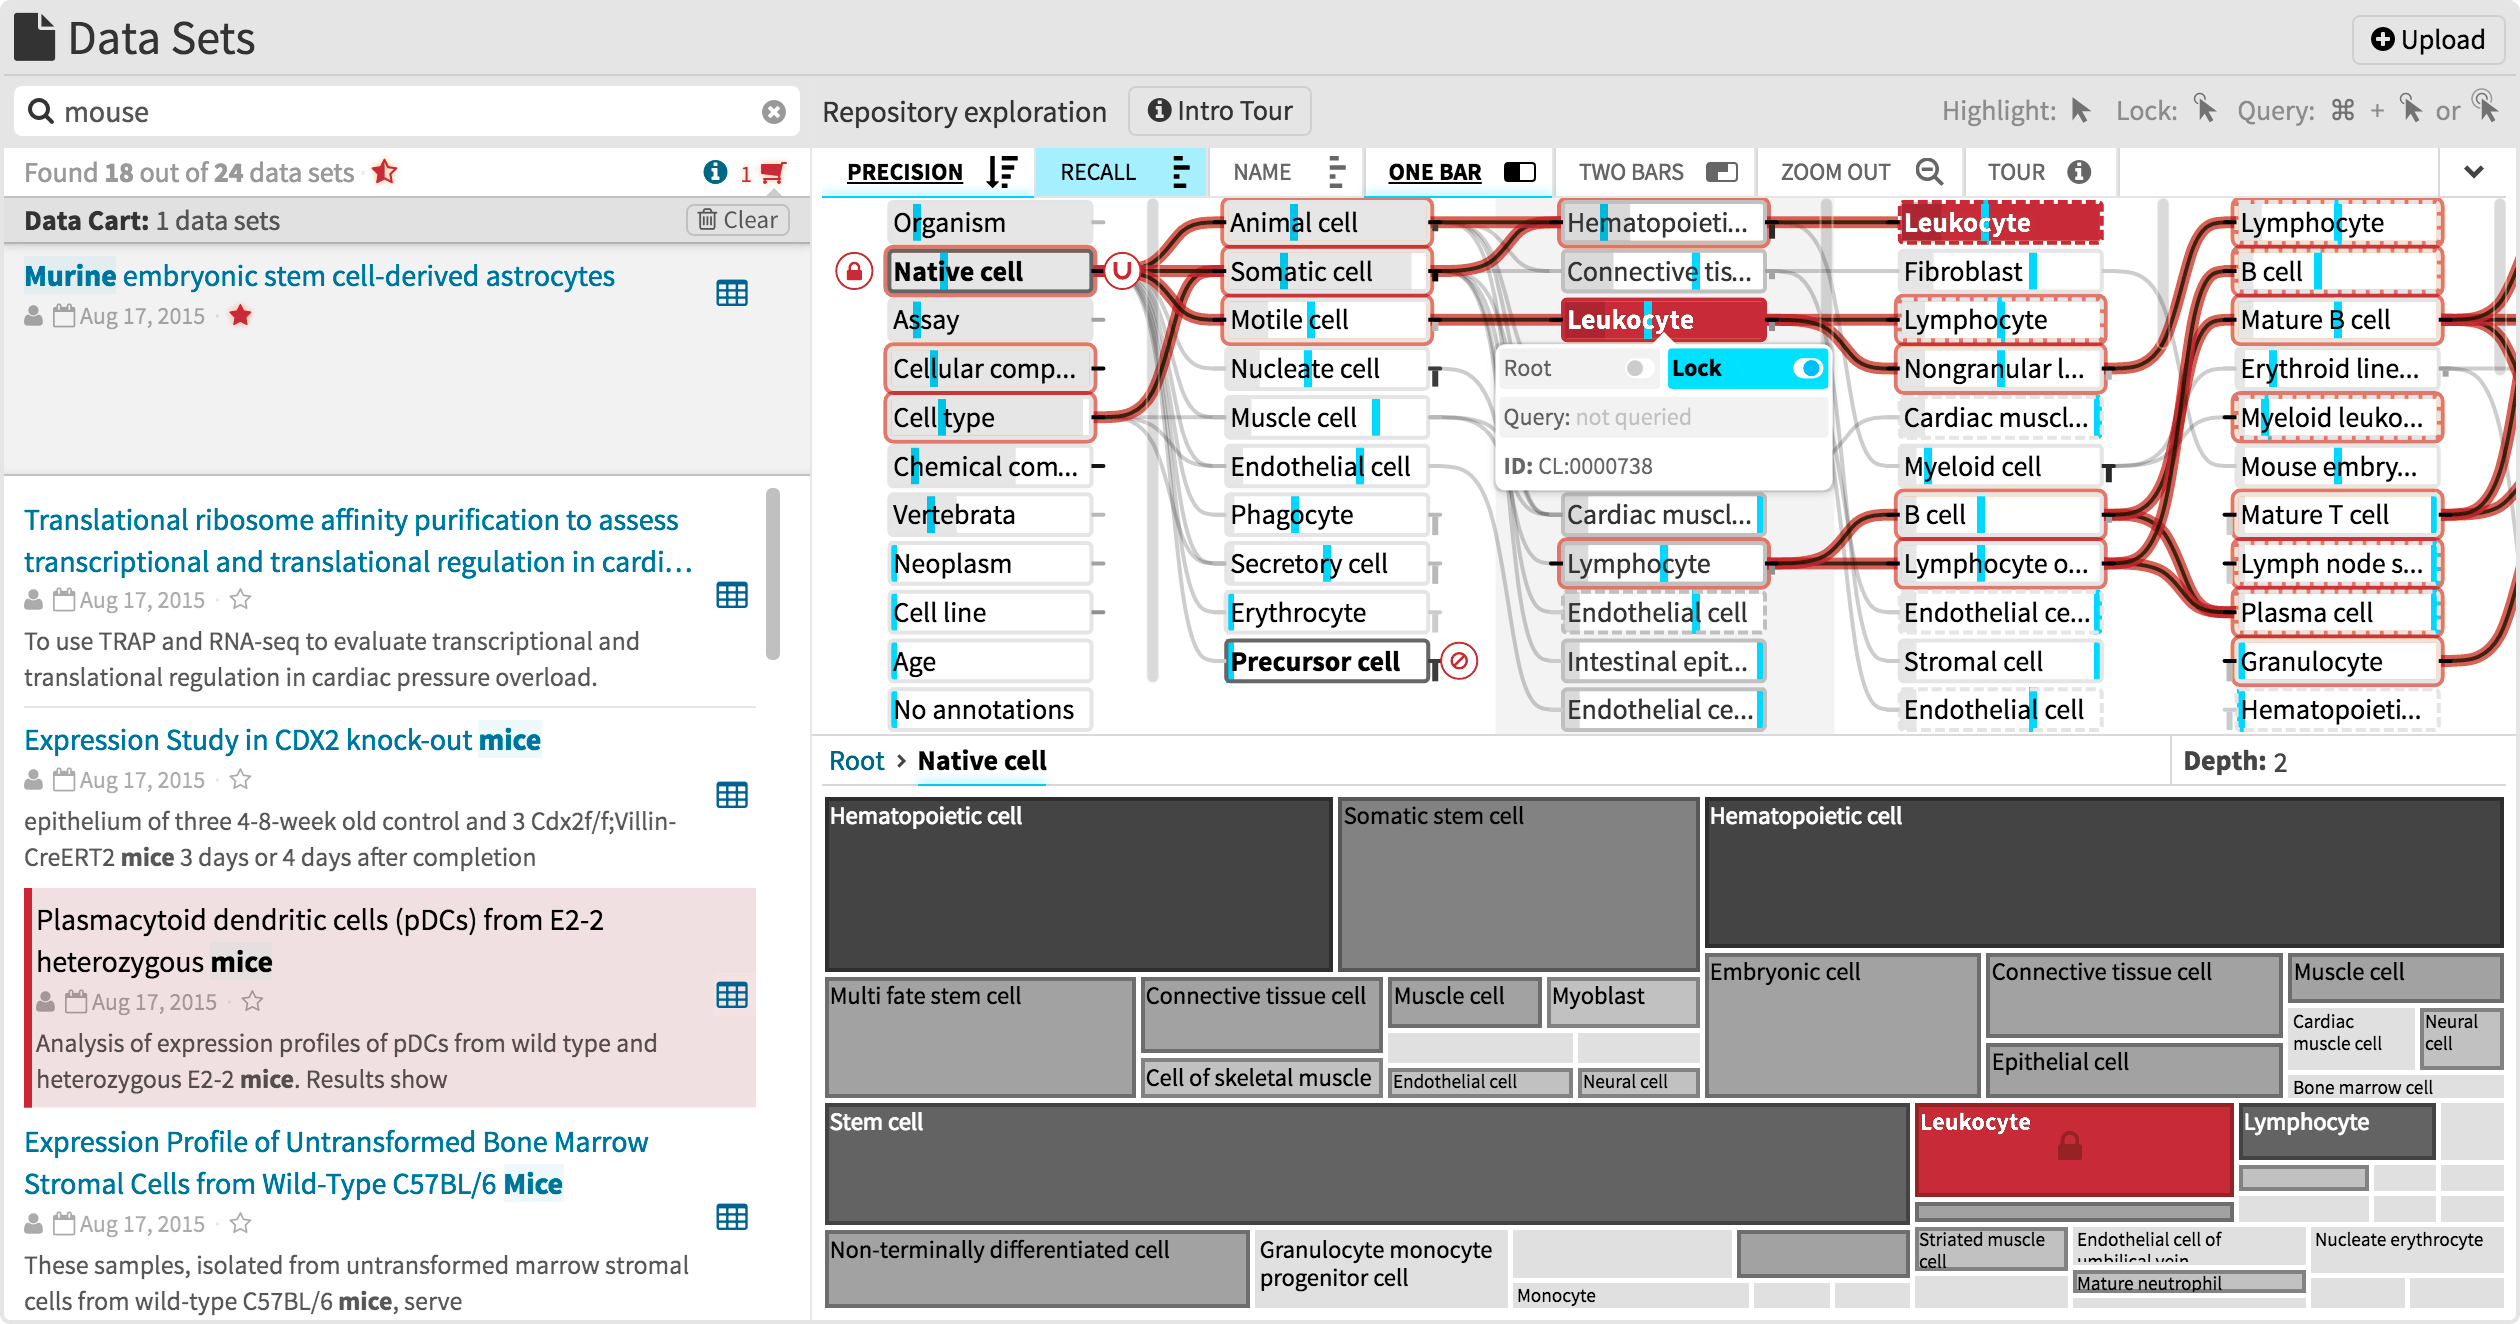
How? SATORI is composed of two main interlinked views: the data set view and the exploration view. In the treemap an ontology term is illustrated by a rectangle. The area of the rectangle visualizes the size of the term relative to its sibling terms and the color indicates the distance to the farthest child term. The farther away this child term is, the darker is the color. The node-link diagram represents ontology terms as nodes and links shown parent and child terms (Fig. 5). Additionally, the diagram visualizes the precision and recall (Fig. 4) for each term given the currently retrieved data sets. In this context, precision is useful to understand how frequently a term is used for annotation in the retrieved set of data sets and recall provides a notion of information scent by indicating if there are more data sets annotated with this term. Finally, the exploration view acts as a semantic query interface and lets users filter down collections of data sets via ontology term-based Boolean queries.
Publication
-
SATORI: A System for Ontology-Guided Visual Exploration of Biomedical Data Repositories
Bioinformatics, Volume 34, Issue 7, 1 April 2018, Pages 1200–1207. doi: 10.1093/bioinformatics/btx739
Source Code
All parts of SATORI are publicly accessible and open-source.
- https://github.com/refinery-platform/refinery-platform
- https://github.com/refinery-platform/neo4j-ontology
- https://github.com/refinery-platform/ontology-imports
- https://github.com/flekschas/d3-list-graph
- https://github.com/flekschas/owl2neo4j